As many people know, I am planning my wedding for next year. In a lot of scenarios in business, we need to be able to have a quick view of how money is being spent towards a specific goal or project. Without being an expert in data visualization tools such as Power Pivot in Excel or Power BI, you can take a set of simple data and use the Quick Chart web part within your SharePoint site to be able to tell the story.
Set up your list
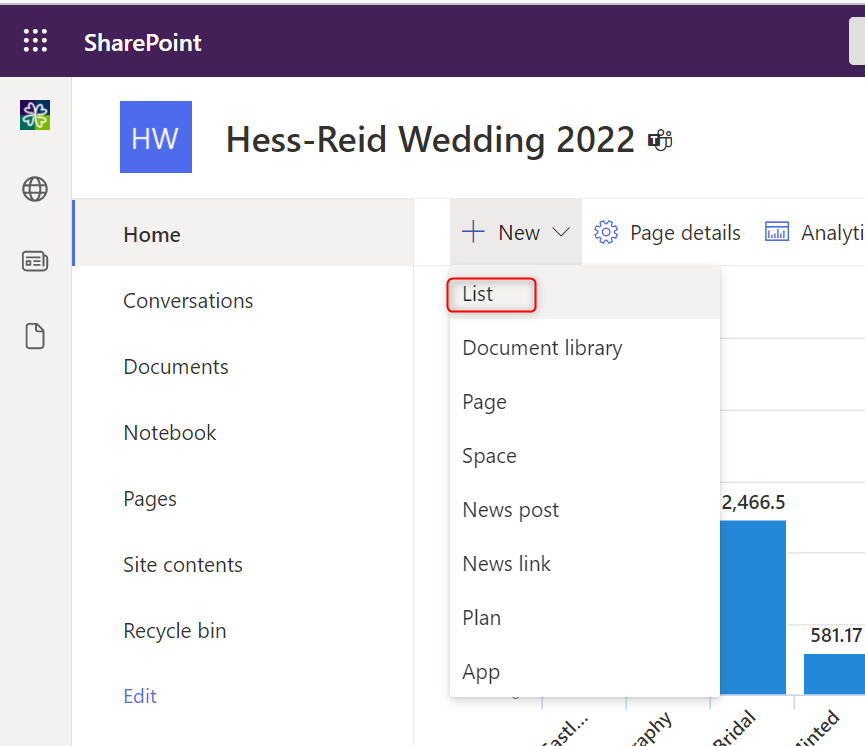
First, you need to create your list within your SharePoint site. You need to have member or owner permissions within the site to be able to edit or create new items.
When you are considering the fields needed for the list, you must have at least one type of number column in order to use the Quick Chart web part later on. You can add the number column or also use a currency column to tell your story.
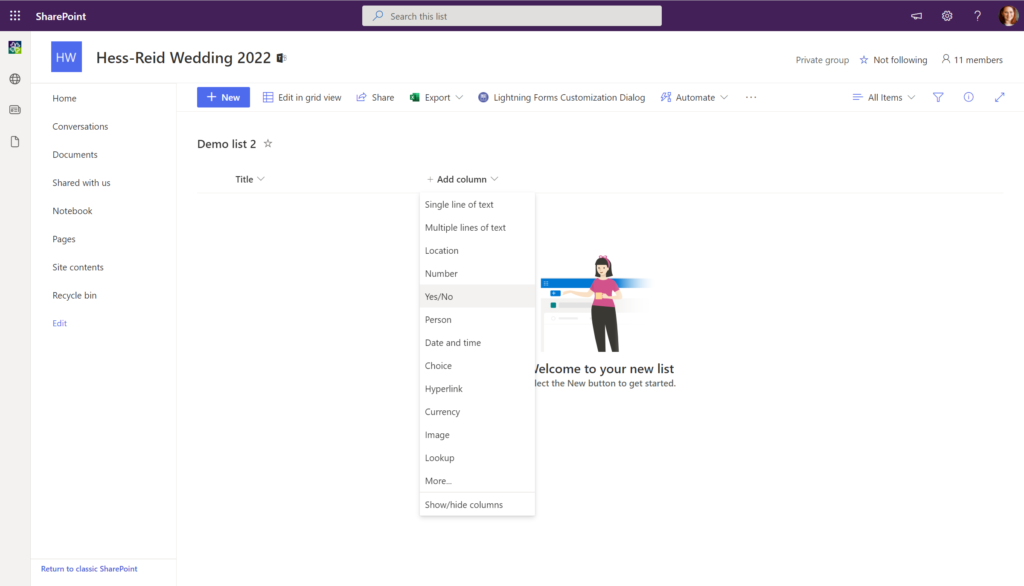
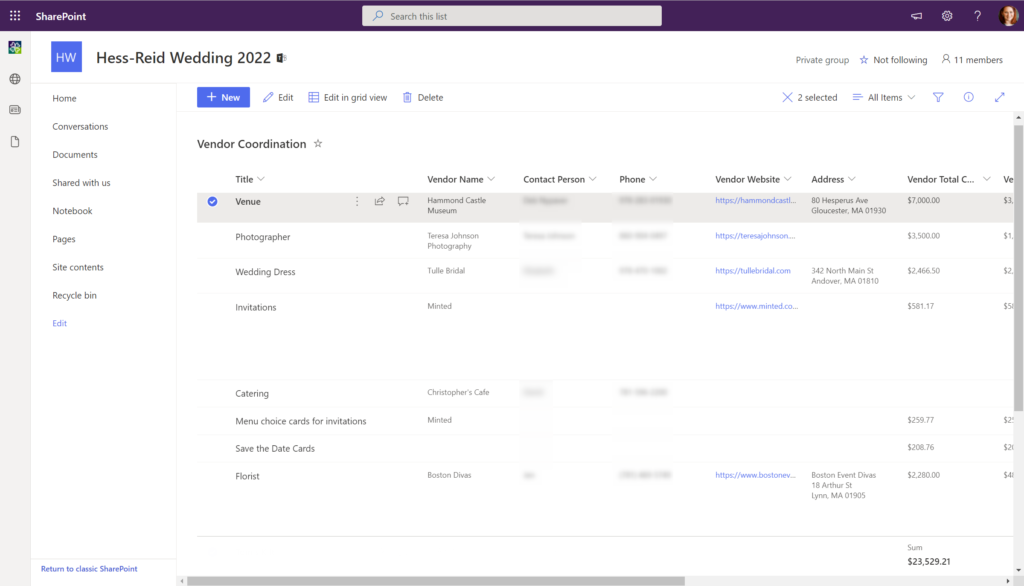
Once you have added all of your columns, Fill in the list items to build out the content within your list.
Now that you have your list set up, navigate back to your page where you would like to place the chart.
Add and configure Quick Chart web part
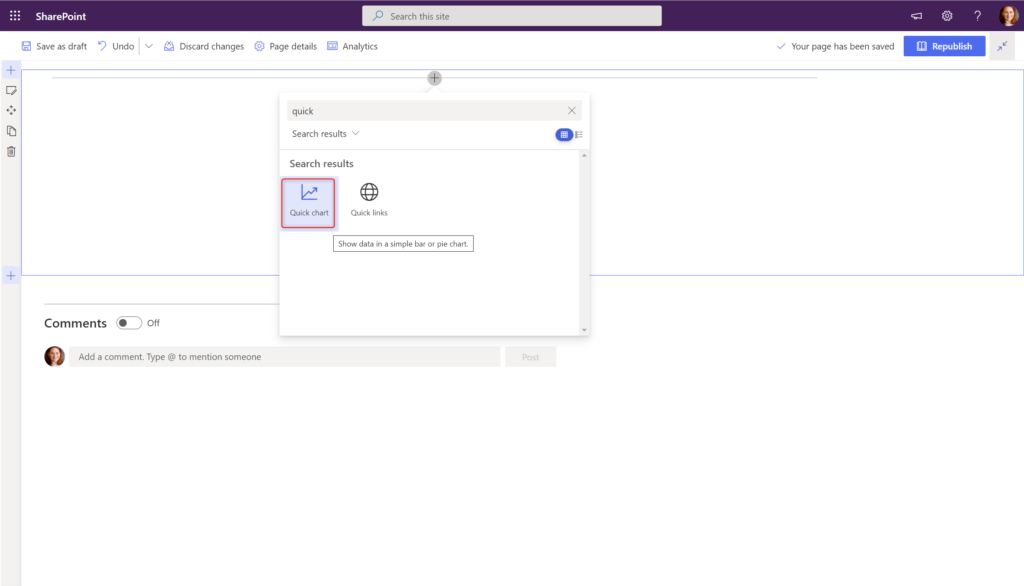
Once you are on your page, be sure to put the page in edit mode and add the Quick Chart web part to the page.
Select the edit icon on the left to open up the config panel for the web part.
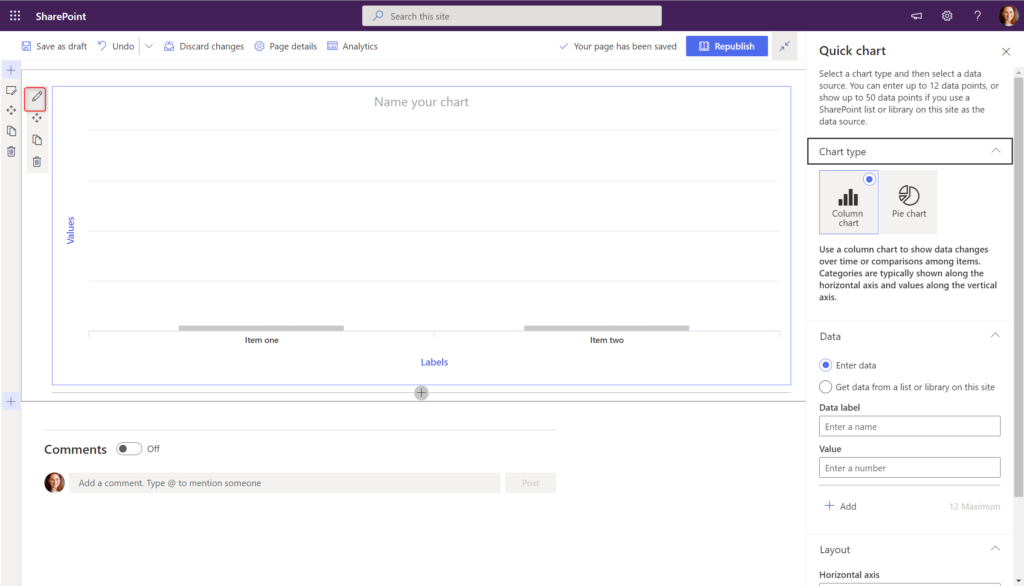
Configure your chart
Select which kind of chart you want to use
- Column Chart – Better if you want to show percentages of a whole
- Bar Chart – Better if you have more items in the list
Data:
Select “Get data from a list or library on this site“
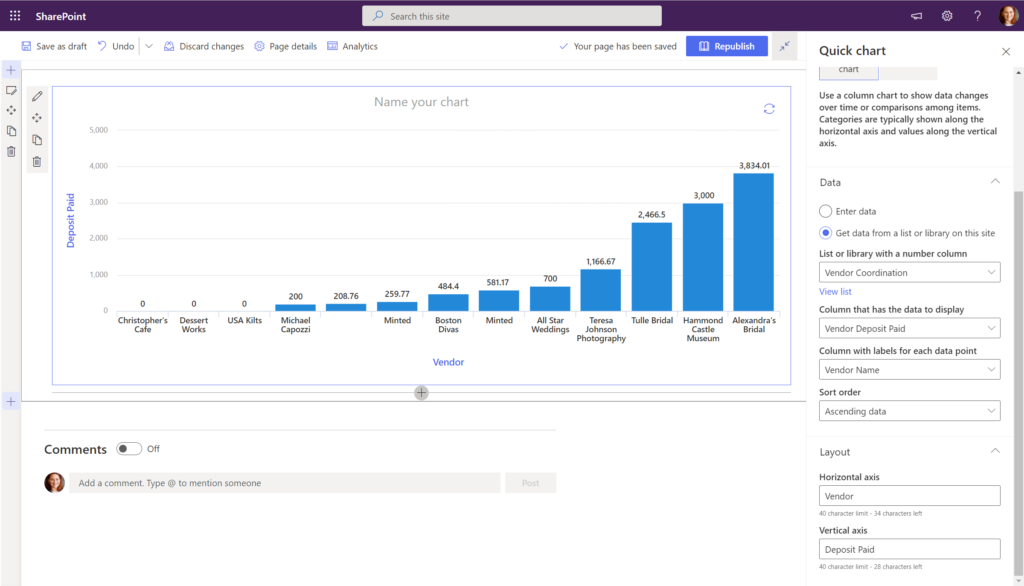
You can only choose a list or library that has a number column, so if you do not see your list in the dropdown, this is the most likely reason.
Select the column that has the data you want to display and the column in the list with the label that you want to use.
You can choose to sort the columns. In this case, I will sort by ascending order
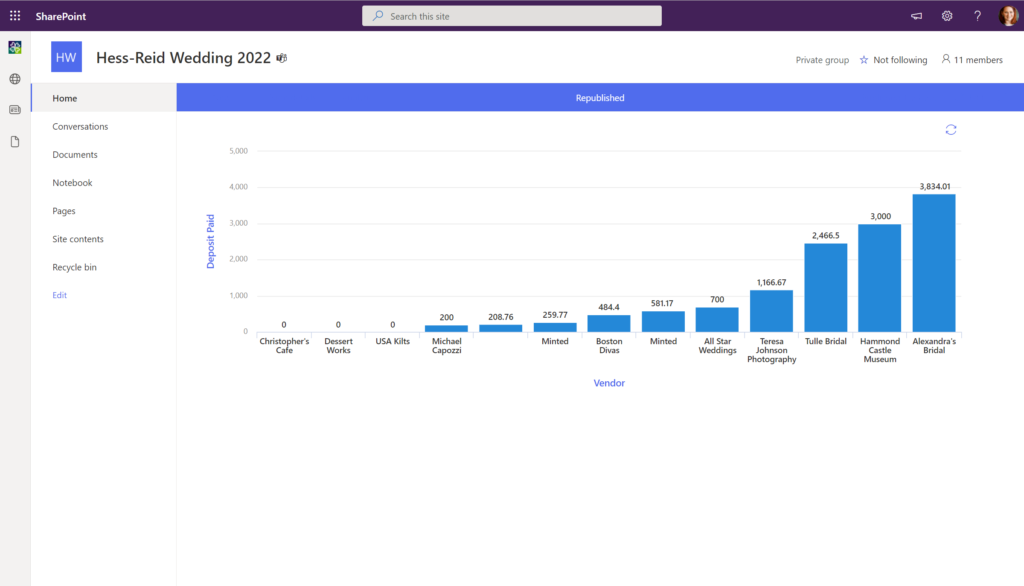
Make sure to label your horizontal and vertical access so a user will understand the correlation.
Once you are finished, remember to republish your page. Your chart is now available for everyone with permissions to view.